Where are markets headed? The billion-dollar question that is on the mind of every investor.
Investors peruse through reams of information every day on market direction. Media and stock brokers publish gazillion analyses on the same. You pick up a financial newspaper and sensational headlines stare at you. Like the headline I woke up to yesterday: “Indian Equities nosedive on US Fed’s commentary”
Yet amidst all these, do we know where the markets are headed? I can’t help remembering the popular dialogue from the movie Wolf of Wall Street:
“Nobody knows if a stock is going up, down, sideways or in circles; least of all stock brokers”
Wolf of Wall Street Movie

So, we can follow as many parameters and complicated analysis as we want. But no one knows where are markets headed. In fact, for most of us with a career outside markets, it is impossible to stay abreast with all this information.
So, I use a simple measure: Sensex P/E. Sensex P/E like a compass that gives a good sense on direction of markets.
If you are familiar with Sensex P/E, then you can skip the below section and continue reading from Why is Sensex P/E a Compass for Markets?
What is P/E?
PE or P/E stands for Price to Earnings Ratio.
This ratio is applicable when you buy the share of a company.
P stands for the price of the share. And E stands for EPS or Earning Per Share. EPS means the profit per share generated by a company.
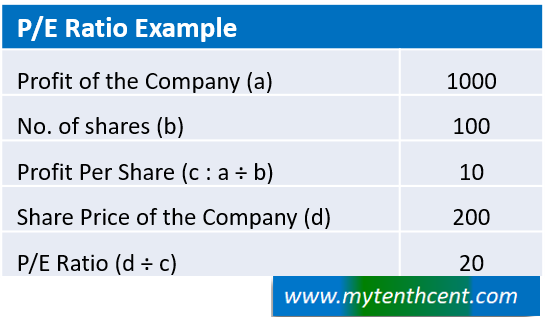
Let me explain with an example. Let us assume that a company has 100 shares and generates a profit of INR 1000. In this case the EPS or Profit Per Share would be 10 (INR 1000 of profit divided by 100 shares). Now let us further assume that the company’s share price is INR 200 for each share. Then P/E would be 20 (INR 200 divided by EPS of 10).
So, P/E ratio indicates, how many times the profits will an investor pay for a company. If P/E ratio is 20, then the investor is willing to pay 20 times the profit.
Sensex P/E:
Sensex is the index based on the market value of top 30 largest companies in India. You can find the list of the 30 companies here. The current value of Sensex is around 58,000.
Sensex is an excellent indicator of stock market performance. If Sensex goes up, it means stock markets are rising and if Sensex falls, then markets are falling.
As given earlier, P/E indicates how many times the profits of a company, will an investor pay for the company. Likewise, Sensex P/E indicates how many times the profit of this Index, will an investor pay.
A Sensex P/E of 30 means, Sensex is trading at 30 times the profit of the Index. And profit of the index is the profit per share generated by the 30 companies. So effectively, Sensex P/E stands for how many times the profit of the 30 largest companies in the country is their market value.
Why is Sensex P/E a Compass for Markets?
To answer this question, we need to look at the yearly P/E ratio of Sensex since 1999; i.e., a period of roughly 23 years.
If we look at this data, we can identify 3 zones: Red, Yellow and Green. Red Zone being the zone with highest risk to investment. Yellow Zone being medium risk zone and Green Zone being the safe zone to invest.
In terms of numbers, the Red Zone is Sensex P/E upwards of 22, Yellow Zone is Sensex P/E 20 to 22 and Green Zone is Sensex P/E below 20. Up until 2019, whenever Sensex P/E crossed 22, there has been a market correction. In simpler words, you are paying too much and there isn’t enough profit potential at those levels.
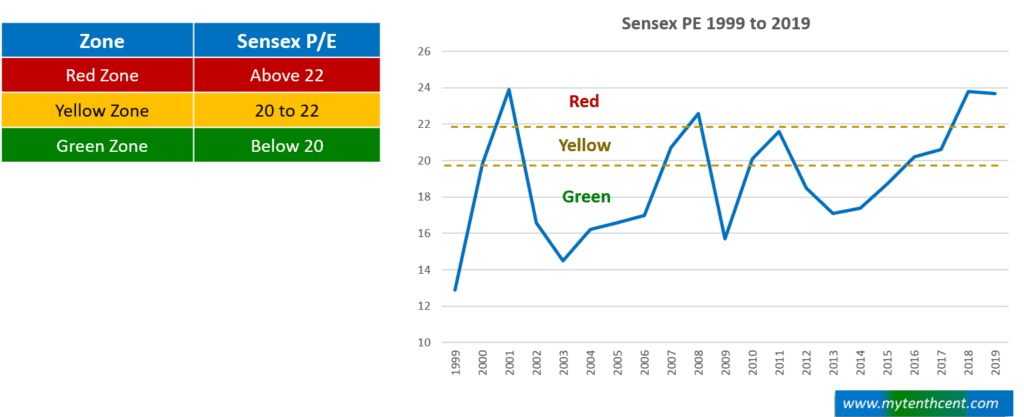
So, if we look at the last 20-to-25-year data, we can note that Sensex P/E works like a compass giving the direction of the market.
And now back to the original question.
Where are Markets Headed?
Sensex is currently hovering at around 58,000 levels and Sensex P/E ratio is around 26 – 27. For a brief period of time Sensex went down to 56,500 this month. Then I started receiving messages about how it is a good time to buy because of the correction from 60,000 to 56,000.
Nonetheless, as I have outlined above, current markets are clearly in the Red Zone. So, I am not excited about whatever little correction has happened now.
But before concluding, one final piece of analysis below.
What Justifies Sensex Levels >55,000?
There are 2 perspectives to ponder about Sensex above 55,000:
1. Should we redefine the Red, Yellow and Green zones?

Instead of considering Sensex P/E above 22 a Red Zone, should we reconsider the boundaries? Perhaps something has happened that the Yellow Zone boundary is no longer at 22. May be Yellow Zone now stretches all the way up to 30 or 32 and these markets are not in a high-risk zone.
But if you look at the overall situation, nothing justifies redefining the zones at this point of time.
2. What about profit growth of companies?
If we revisit our high school mathematics, a ratio can increase or decrease depending on how numerator or denominator changes. And if denominator increases, a ratio will decrease.
In Sensex P/E ratio, the numerator is Sensex levels and denominator is profit of the companies in Sensex. So, if the profits of the companies grow significantly over the next 2 to 3 years, then even with Sensex >55000, the Sensex P/E ratio will come down.
So how much should profits grow so that even with Sensex at 55,000, the Sensex PE comes into Yellow Zone or Green Zone? The adjoining table shows these numbers.
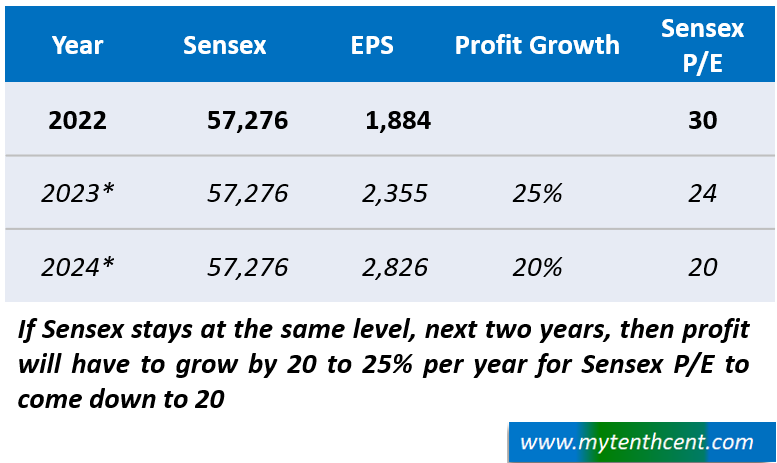
The profits of the largest 30 companies in India needs to grow at close to 20 to 25% in the next 2 years, for Sensex P/E to go back to safe zone.
Now we need to remember that we are talking about the largest 30 companies in India. At their size and scale, it is not easy and often impossible to grow profits by more than 20%. If you look at last 10 years, you will see that 15% to 18% is the high growth zone for Sensex profits. So how realistic is a profit growth of 25%?
Conclusion:
So, all in all it is tough to justify the current Sensex levels. May be the profits of large companies will beat historic trends and grow by 25% for the next 2 to 3 years. I would never bet my money on it though.
I think these markets are headed for choppier waters and I prefer to sit tight. What about you?
One Reply to “Where are markets headed?”
Comments are closed.